
Industrial environments commonly require systematic assessment of sound levels to document exposures, evaluate equipment noise, and support risk management. This process involves instruments, measurement protocols, and data analysis to quantify sound pressure levels across time and frequency. The objective is typically to provide an accurate, reproducible record of workplace acoustics so that controls, policies, or engineering responses can be informed by measured values rather than estimates.
Measurement activities may include spot checks near machinery, continuous monitoring in occupied areas, and personal monitoring worn by workers during specific tasks. Results are usually expressed using standard acoustic metrics and weightings that approximate human hearing, and measurements can be used to track trends, verify controls, or support compliance with applicable exposure limits.
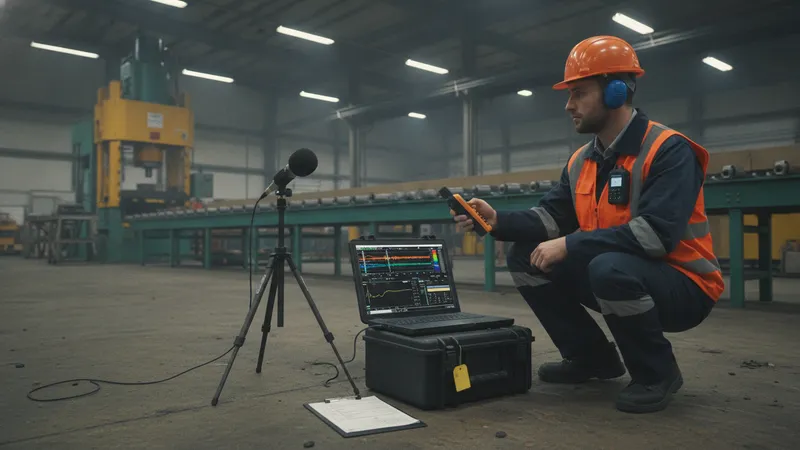
Metrics and units used in workplace acoustic assessment typically include decibels (dB) with A-weighting (dBA) to approximate perceived loudness, as well as equivalent continuous sound level (Leq or LAeq) to represent average energy over a period. Peak sound levels and C-weighted measures may be recorded when impulsive or very loud events are present. Understanding which metrics are most relevant depends on the assessment purpose: exposure assessment often emphasizes time-weighted averages, while equipment testing may require spectral analysis.
Personal monitoring with dosimeters may be used when task variability affects an individual's exposure. Dosimeters can often be configured with criterion levels and exchange rates that align with commonly cited occupational exposure frameworks; typical practice includes a full-shift sample and task-based logging for high-noise activities. For area measurements, placement and height relative to workers and machinery should be documented so that results are reproducible and comparable across sampling sessions.
Frequency analysis can clarify whether noise contains tonal components or energy concentrated in specific bands that may require engineering attention. Octave- or third-octave-band data often guide noise control design and selection of mitigation measures such as mufflers or enclosures. Spectral data may also inform audiometric considerations and help distinguish between broadband and narrowband sources when interpreting measurement results.
Calibration and quality assurance are central to reliable measurement. Instruments are typically calibrated with a reference source before and after field sessions, and periodic laboratory calibration may be scheduled according to manufacturer guidance or institutional protocols. Recordkeeping often includes calibration logs, instrument serial numbers, measurement settings, environmental conditions, and metadata that support traceability and interpretation of results.
In summary, the initial overview emphasizes a measurement-based approach that combines instruments, metrics, and procedures to characterize workplace sound. The following pages examine instruments and metrics, sampling and mapping methods, frequency analysis and data interpretation, and calibration and recordkeeping in more detail. The next sections examine practical components and considerations in more detail.
Measurement instruments vary by purpose: handheld sound level meters are often chosen for area surveys, while personal dosimeters are used to quantify individual exposures over time. Sound level meters commonly report LAeq, Lmax, and Lmin, and more advanced meters can log time-series data. Dosimeters typically compute a dose or time-weighted average based on configured exchange rates and criterion levels. Selection of the instrument may depend on the measurement duration, required metrics, and the need for spectral analysis. Practical considerations include battery life, data storage, and environmental protection for devices in harsh industrial settings.
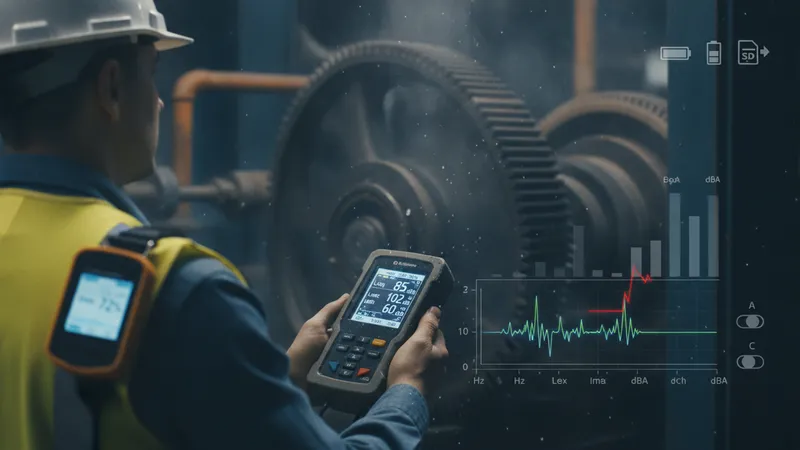
Acoustic metrics are selected to align with assessment aims. A-weighted decibels (dBA) are frequently used to approximate human hearing sensitivity for continuous noise, while C-weighting may be used for peak measurements or when lower-frequency energy is significant. Time-averaged metrics like LAeq express cumulative exposure over a defined period and can be converted to equivalent dose percentages when comparing against exposure criteria. Peak and impulse levels are important for sources that produce short-duration high-amplitude events; these may be reported alongside integrated metrics for a fuller characterization.
Instrument performance parameters—such as measurement range, frequency weighting options, time weighting settings, and dynamic range—can affect data quality. For tasks involving rapidly changing noise, fast time weighting or high sampling rates may better capture peaks and transient events. For steady-state machinery, slower integration may suffice. Users often document measurement settings and environmental conditions (temperature, wind) because these factors can influence readings and are important for interpreting results and establishing comparability between sessions.
Considerations for data handling include choosing formats for storage, ensuring timestamp synchronization, and maintaining consistent labeling of measurement locations and activities. Data export in standard formats enables post-processing and visualization. Where multiple instruments are deployed, inter-device consistency checks—such as side-by-side comparisons on a reference source—may help identify systematic differences and reduce uncertainty in comparative analyses. These practices support more robust interpretation of measured levels.
Sampling strategies should aim to capture representative conditions for the objectives at hand. For general exposure assessment, full-shift personal sampling may be prioritized to estimate average worker dose. For source characterization or control evaluation, short-duration task-based samples or area measurements near machinery can be appropriate. Planning typically considers variability in operations across shifts, seasonal changes, and maintenance cycles. Documentation of operational states and sample start/stop times helps link measured data to specific activities or processes that may drive noise levels.
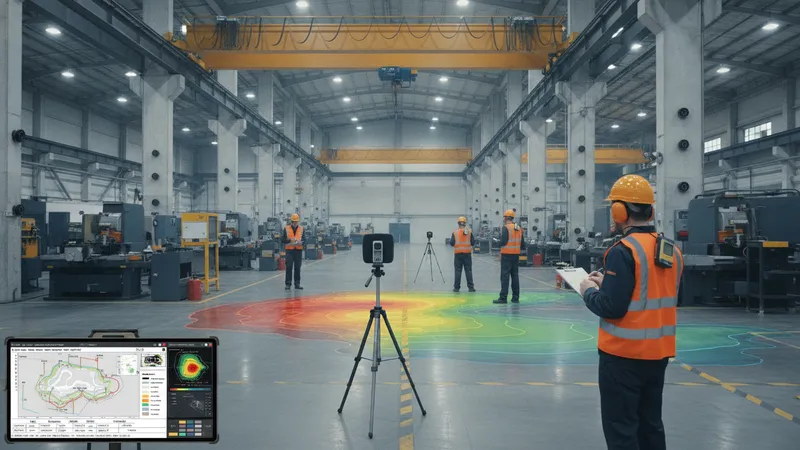
Workplace noise mapping integrates spatial sampling with modeling or interpolated sensor networks to visualize sound level distribution across an area. Maps are often created by combining point measurements taken at standardized heights and positions with modeling software that accounts for source geometry and reflections. Such maps can reveal spatial hotspots and guide placement of controls, administrative zones, or hearing protection signage. When creating a map, consistent measurement protocols and metadata—such as measurement height and surrounding obstacles—support interpretability and repeatability.
When using personal dosimetry alongside area mapping, cross-referencing the time-stamped personal exposure data with location-based maps can link exposure peaks to spatial contexts or tasks. Task-based sampling can help isolate contributions from specific equipment or operations. For facilities with intermittent operations, capturing representative cycles is important, and repeated measurements may be necessary to establish a range of expected conditions rather than a single snapshot.
Practical site considerations include safe placement of instruments, securing devices to prevent tampering, and minimizing flow-induced noise for outdoor or ventilated areas. For longer monitoring campaigns, periodic inspections of deployed sensors and verification of data integrity can identify issues early. Clear labeling of measurement points and consistent file-naming conventions facilitate later synthesis of multi-day or multi-location datasets and support transparent reporting of results.
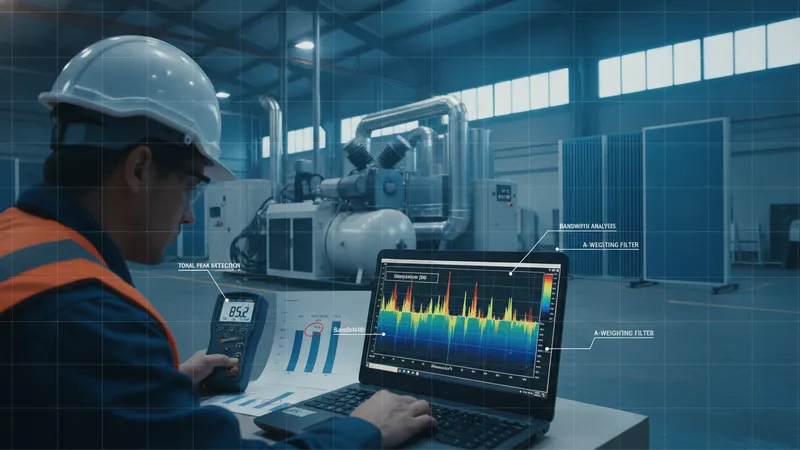
Frequency analysis decomposes sound into components that can reveal tonal peaks, narrowband sources, or dominant frequency ranges associated with specific equipment. Octave-band or third-octave-band data are commonly used for engineering decisions and for designing mitigation measures such as barriers or absorbers targeted at problematic bands. Fast Fourier Transform (FFT) analyzers provide higher-resolution spectral views and can capture transient spectral content. Interpretation of spectral data typically considers both amplitude and bandwidth of peaks to assess whether tonal noise may be prominent enough to require targeted controls.
>